
Under 10,000
“A great candidate for Road Diets in most instances. Capacity will most likely not be affected.”


Since spring 2025, neighbors have counted traffic around the clock from windows along ten Mount Vernon blocks. The streets turned out to be carrying a fraction of the traffic they were built for, causing drivers to routinely break the speed limit past our front doors.
By reclaiming our streets for people, we can reduce congestion, pollution, and crashes while strengthening community life, local businesses, and safety.
Over a third of the cars our counter measured on East Madison Street from September 2025 through August 2026 were over the posted 25 mph limit. In 90.9% of the hours we could measure well, at least one car in five was speeding.
| 5 AM | 6 AM | 7 AM | 8 AM | 9 AM | 10 AM | 11 AM | 12 PM | 1 PM | 2 PM | 3 PM | 4 PM | 5 PM | 6 PM | 7 PM | 8 PM | |
|---|---|---|---|---|---|---|---|---|---|---|---|---|---|---|---|---|
| Mon | 63% | 48% | 32% | 30% | 30% | 32% | 32% | 31% | 34% | 38% | 38% | 40% | 34% | 34% | 32% | |
| Tue | 63% | 44% | 27% | 25% | 29% | 30% | 28% | 29% | 30% | 34% | 36% | 35% | 31% | 31% | 31% | |
| Wed | 61% | 43% | 26% | 24% | 29% | 30% | 29% | 30% | 29% | 34% | 34% | 34% | 31% | 30% | 28% | |
| Thu | 62% | 44% | 26% | 27% | 29% | 29% | 29% | 29% | 30% | 32% | 34% | 33% | 30% | 28% | 30% | |
| Fri | 63% | 50% | 41% | 31% | 31% | 32% | 32% | 31% | 32% | 36% | 36% | 34% | 28% | 26% | 24% | |
| Sat | 51% | 41% | 40% | 36% | 37% | 36% | 32% | 31% | 30% | 26% | 23% | 26% | 25% | 26% | ||
| Sun | 55% | 45% | 29% | 31% | 30% | 35% | 35% | 32% | 35% | 31% | 32% | 33% | 34% | 33% |
| 5 AM | 6 AM | 7 AM | 8 AM | 9 AM | 10 AM | 11 AM | 12 PM | 1 PM | 2 PM | 3 PM | 4 PM | 5 PM | 6 PM | 7 PM | 8 PM | |
|---|---|---|---|---|---|---|---|---|---|---|---|---|---|---|---|---|
| Mon | 24% | 51% | 43% | 30% | 28% | 26% | 23% | 20% | 23% | 23% | 20% | 19% | 22% | 31% | 35% | 36% |
| Tue | 24% | 54% | 41% | 28% | 21% | 21% | 20% | 19% | 22% | 20% | 15% | 13% | 15% | 23% | 32% | 34% |
| Wed | 26% | 53% | 40% | 28% | 22% | 18% | 20% | 18% | 22% | 22% | 15% | 13% | 14% | 21% | 32% | 34% |
| Thu | 23% | 54% | 41% | 26% | 24% | 23% | 21% | 19% | 22% | 23% | 16% | 14% | 17% | 22% | 31% | 33% |
| Fri | 28% | 56% | 43% | 32% | 27% | 22% | 19% | 18% | 20% | 19% | 16% | 18% | 19% | 23% | 28% | 30% |
| Sat | 39% | 32% | 27% | 42% | 35% | 28% | 25% | 21% | 22% | 22% | 23% | 28% | 27% | 28% | 29% | 36% |
| Sun | 47% | 38% | 35% | 34% | 25% | 24% | 25% | 26% | 28% | 27% | 30% | 29% | 34% | 39% | 44% |
| 5 AM | 6 AM | 7 AM | 8 AM | 9 AM | 10 AM | 11 AM | 12 PM | 1 PM | 2 PM | 3 PM | 4 PM | 5 PM | 6 PM | 7 PM | 8 PM | |
|---|---|---|---|---|---|---|---|---|---|---|---|---|---|---|---|---|
| Mon | 17% | 18% | 23% | 24% | 23% | 24% | 24% | 24% | 20% | 18% | 17% | 18% | 16% | |||
| Tue | 15% | 19% | 23% | 25% | 24% | 24% | 27% | 27% | 19% | 16% | 15% | 16% | 15% | 11% | ||
| Wed | 16% | 19% | 23% | 20% | 23% | 24% | 26% | 25% | 18% | 14% | 15% | 15% | 13% | |||
| Thu | 16% | 23% | 26% | 26% | 23% | 25% | 27% | 24% | 20% | 14% | 15% | 14% | 12% | |||
| Fri | 16% | 17% | 22% | 24% | 20% | 23% | 23% | 22% | 17% | 15% | 15% | 16% | 11% | |||
| Sat | 14% | 16% | 15% | 15% | 16% | 16% | 19% | 17% | 16% | 19% | 17% | 14% | ||||
| Sun | 23% | 20% | 19% | 19% | 17% | 17% | 21% | 20% | 21% |
Share of cars over the posted 25 mph limit in each hour of the week on three of our streets, September 2025 through August 2026 (West Mulberry Street: February 16 through August 31, 2026). Darker is worse. Blank cells are hours we didn’t count because it was dark or there were fewer than 100 cars. Hover over or tap a cell to see its value.
A majority of the 220 cars our counter measured on North Calvert Street in one hour, Tue Sep 23, 2025, 3 PM, were over the posted 30 mph limit. Measured against a 25 mph safe speed limit, it was 71.9%.
On an average day in the last year, about 1,120 cars on East Madison Street were measured over 25 mph, and 171 were going 35 mph or faster. On Park Avenue, 324 a day were over the limit and 82 were at 35 mph or more.
Speeding kills. In addition to being designed for speed, many of our streets are signed that way too. The 30 mph speed limit on some of our streets contradicts guidance on urban speed limits, including Baltimore City’s Complete Streets Manual. Comparing speeding to those inappropriate 30 mph limits disguises the scale of the speeding problem.
25 mph is the top of the 20 to 25 mph target range Baltimore’s Complete Streets Manual sets for streets like ours, and the highest limit national guidance recommends for most city streets.
| Street | Over 25 mph | 35 mph or faster | Total over 25 mph | Worst daylight hour | Cars that hour |
|---|---|---|---|---|---|
| East Madison Street | 33.5% | 5.0% | 403,768 | 74.3% over 25 mphTue Jun 30, 2026, 6 AM | 188 |
| West Mulberry Street | 25.2% | 1.9% | 494,901 | 67.5% over 25 mphMon Jul 13, 2026, 6 AM | 392 |
| Park Avenue | 19.1% | 4.7% | 118,289 | 60.8% over 25 mphThu Nov 13, 2025, 11 AM | 107 |
| West Madison Street | 16.2% | 4.1% | 151,951 | 61.8% over 25 mphSun Apr 5, 2026, 4 PM | 141 |
| East Eager Street | 11.8% | 0.7% | 63,113 | 38.4% over 25 mphFri May 1, 2026, 9 AM | 136 |
A 30 mph limit is dangerous on streets like these and goes against the Complete Streets Manual, which says to “Apply the lowest recommended speed limit for the road’s Street Type.” Every figure in this table is calculated against a 25 mph safe speed limit, not the posted 30 mph.
| Street | Over 25 mph | 35 mph or faster | Total over 25 mph | Worst daylight hour | Cars that hour |
|---|---|---|---|---|---|
| East Preston Street | 22.5% | 3.8% | 308,341 | 69.2% over 25 mphThu Dec 25, 2025, 9 AM | 114 |
| North Calvert Street | 20.2% | 4.0% | 133,339 | 74.4% over 25 mphMon Sep 29, 2025, 4 PM | 624 |
| Saint Paul Street | 17.5% | 3.5% | 286,554 | 65.5% over 25 mphFri Jul 17, 2026, 6 AM | 300 |
| East Franklin Street | 8.2% | 0.6% | 289,729 | 31.3% over 25 mphThu Dec 25, 2025, 12 PM | 418 |
| North Charles Street | 0.9% | 0.3% | 9,541 | 29.7% over 25 mphSat Sep 6, 2025, 3 PM | 112 |
Each column is the share or count of cars measured over 25 mph, or at 35 mph or more. Speeds are measured in daylight only and are accurate to about ±10%. Totals count cars from September 2025 through August 2026; West Mulberry Street’s counter has usable data only from February 16, 2026. Sorted worst first.
Sources: Baltimore City Department of Transportation, Complete Streets Manual (PDF) (2021): Downtown Mixed-Use streets, “Found in downtown districts such as Mount Vernon,” “should have a target speed ranging from 20-25 mph.” National Association of City Transportation Officials, City Limits (PDF) (2020): “This document recommends maximum speed limits of 10-25 miles per hour for most city streets, increasing to 35 mph only in select, limited cases.”
Neighbors photographed these crashes and shared them with us.
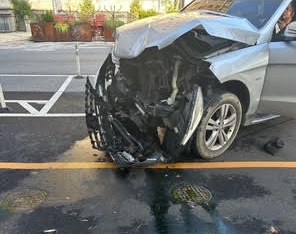
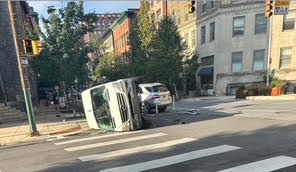
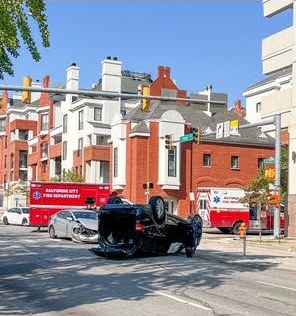
Photographed and posted by neighbors in the Mount Vernon Neighbors (Baltimore City) Facebook group. Used with permission.
Share of people hit by a car who are killed or severely injured, by the car’s speed at impact
At 25 mph, about 88% of people hit survive.
These are impact speeds. A driver who brakes strikes at less than their traveling speed, which is the argument for designing streets people drive slowly on: it lowers both numbers at once.
Source: Brian C. Tefft, Impact Speed and a Pedestrian’s Risk of Severe Injury or Death (PDF), AAA Foundation for Traffic Safety, 2011.
Our counters work out a car’s speed from the time it takes to cross its own length, assuming the length of a typical Belgian car. Telraam, the maker, says speeds “will be underestimated for places where cars are larger (longer),” and American cars are larger. After dark the counters still count vehicles but can’t measure speed, so none of these figures include night driving, when traffic volumes are lower and speeding is likely worse.
Nationally, drivers involved in fatal crashes were more likely to be speeding at night (21%) than during the day (16%).
Source: NHTSA, Traffic Safety Facts: Speeding (PDF) (2023 data).
None of our counted streets are a truck route. The city’s through-truck routes near Mount Vernon are MLK Boulevard, Howard Street, North Avenue and I‑83. Guilford Avenue is a local truck route. On East Madison, West Madison and North Charles Streets, 19% to 25% of the vehicles our counters could classify are bigger than a car: a delivery van, a truck, a tractor-trailer, a bus.
24.7% bigger than a car: 15.2% vans and light trucks, 6.9% trucks and trailers, 2.6% buses
19.1% bigger than a car: 15.3% vans and light trucks, 1.2% trucks and trailers, 2.6% buses
21.2% bigger than a car: 8.6% vans and light trucks, 2.4% trucks and trailers, 10.3% buses
Bars run from 0 to 30%. The counters sort what they see into ten classes. They tell cars from bigger vehicles well, but the finer classes are rougher: on East Madison they count about 110 “buses” a day, more than the 73 CityLink Pink trips scheduled through that block on an average day. The daily counts are daylight only, so the real totals are higher.
East Madison sees about 300 trucks a day on a block that is not a truck route. On Thanksgiving morning 2025, in the 10 AM hour, 59 of the 143 vehicles our counter classified there were bigger than a car.
And this is what it looks like when a large vehicle is in the crash.
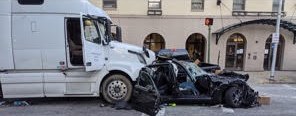
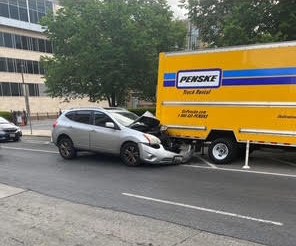
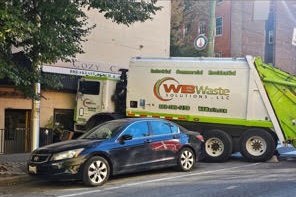
Photographed and posted by neighbors in the Mount Vernon Neighbors (Baltimore City) Facebook group. Used with permission.
Our counters record about 1,840 trips walking or biking past them on average during the daytime. Bus stops on North Charles and Saint Paul Streets see about 1,200 bus boardings every weekday. While we have sidewalks, none of our streets have a full-time dedicated bus lane and most don’t dedicate any safe space for biking.
North Charles Street has a peak-hour bus lane from Madison Street north to the I‑83 ramp at Penn Station. It is in effect two hours a day, 4 to 6 PM, and it is not painted red, because the rest of the day it is a parking lane.
MTA’s 2019 before-and-after study found that it “is regularly blocked by parked vehicles and deliveries, many of whose drivers may not even be aware that this is a bus lane.” Only 18% of buses used it, and evening bus trips on that stretch got 23.1% slower, the worst result of the 19 time periods MTA measured.
Downtown, on Hillen Street and Guilford Avenue, MTA painted a red bus lane that runs all day. It cut evening bus travel time there by 31.7%. The study’s summary: “Bus lanes are most successful when they are in effect full-time (not just during peak periods) and are very clearly marked (painted red).”
bus boardings every weekday at stops on North Charles and Saint Paul Streets (MTA, summer 2024). CityLink Silver and Green, LocalLink 51 and 95, Express BusLink 103, and the free Charm City Circulator Purple Route all run in ordinary traffic here.
Baltimore’s draft High-Injury Network marks the streets where people are most often killed or badly hurt. Half of our studied streets are on it.
| Corridor | Tier | Meters inside the study area |
|---|---|---|
| Franklin-Mulberry corridor | Tier 1 | 1,037 |
| E Madison Street | Tier 1 | 398 |
| N Eutaw Street | Tier 1 | 384 |
| N Martin Luther King Jr Blvd | Tier 1 | 34 |
| W Mount Royal Avenue | Tier 1 | 635 |
| Maryland Avenue | Tier 2 | 574 |
| E Monument Street | Tier 2 | 260 |
| Druid Hill Avenue | Tier 2 | 421 |
| N Paca Street | Tier 2 | 46 |
| N Calvert Street | Tier 3 | 1,518 |
| Saint Paul Street | Tier 3 | 1,524 |
| E Preston Street | Tier 3 | 533 |
| E Biddle Street | Tier 3 | 519 |
| Injury | Walking | Biking | In a vehicle |
|---|---|---|---|
| Killed | 3 | 0 | 2 |
| Seriously injured | 9 | 5 | 23 |
| Minor injury | 35 | 23 | Not in this data |
| Possible injury | 49 | 18 | Not in this data |
Killed and seriously injured count people. Minor and possible injuries count crashes, by the worst injury to the person walking or biking. The city’s crash layers don’t include minor injuries to people in vehicles. In all, 35 crashes killed or seriously injured someone.
When a driver leaves the roadway, they end up on a sidewalk, or in a storefront or a building wall. Sometimes, a person is hit and trapped between them.
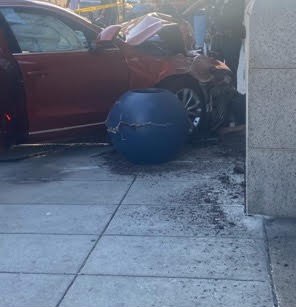
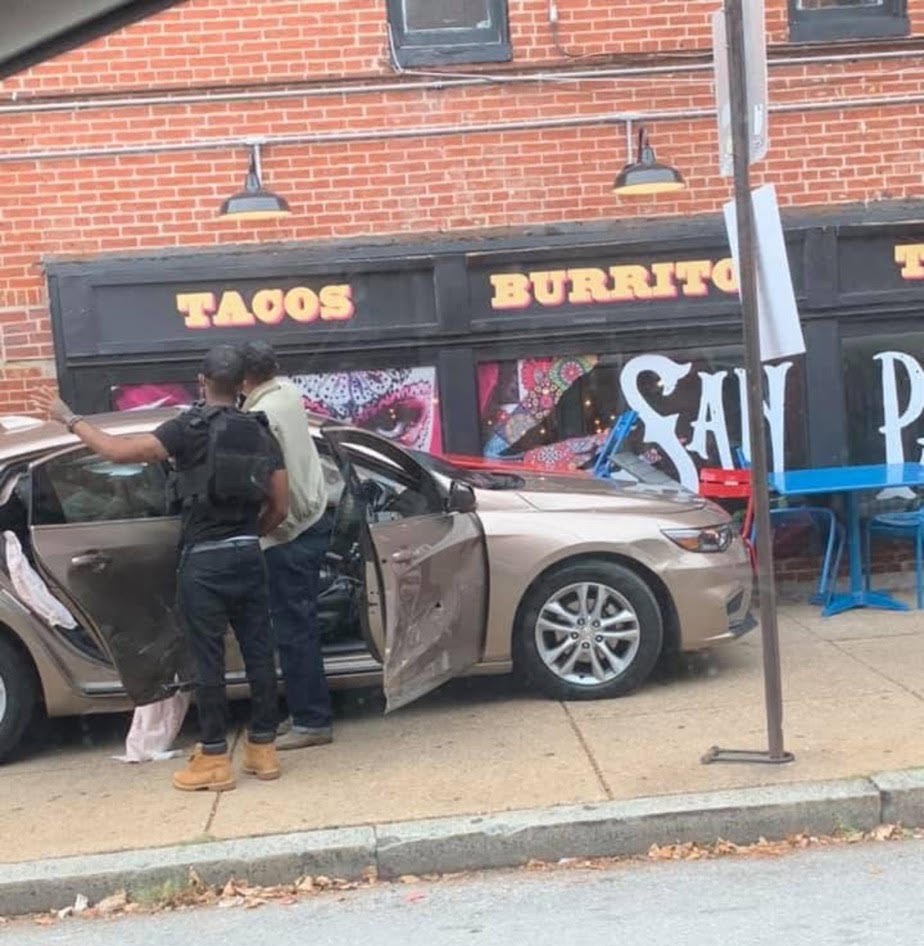
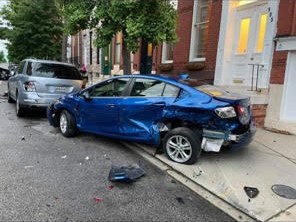
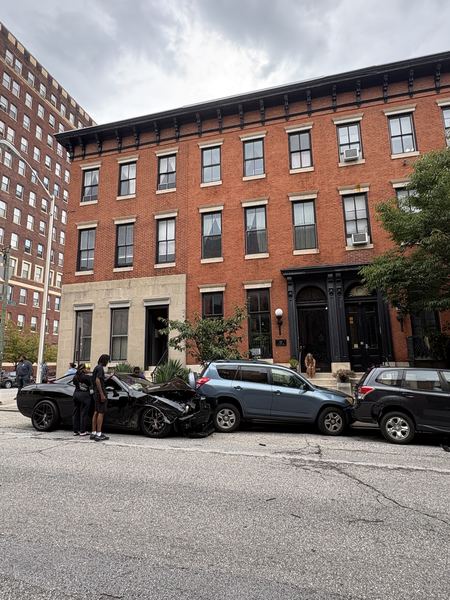
Photographed and posted by neighbors in the Mount Vernon Neighbors (Baltimore City) Facebook group. Used with permission.
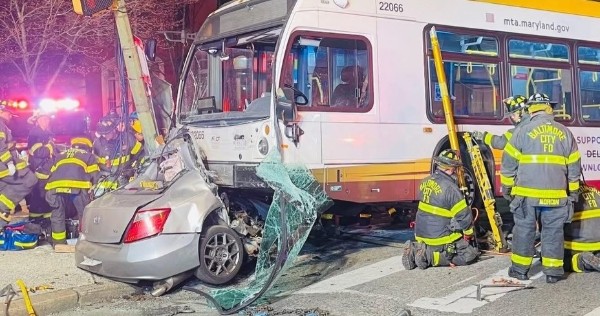
Every one of them meets the standards for a road diet. Fixing these streets does not have to take years or millions of dollars. Much of it can be accomplished with paint.
A “road diet” means taking a traffic lane a street does not need and giving that space to something else: a protected bike lane, a bus-only lane, a wider sidewalk, or room for a business to put tables out. The Federal Highway Administration’s definition is simple: a road diet “repositions pavement markings to better meet the needs of all road users.” The main cost is repainting a street that is already there.
In 1950 Baltimore had nearly 950,000 residents. Today it has about 570,000, a 40% decline. The National Association of City Transportation Officials describes what that leaves on downtown one-way streets like ours: “Today, many of these streets operate significantly below capacity and create swaths of empty pavement in downtown areas.”
The standard way to size a street is Average Daily Traffic: how many vehicles actually use it on a normal day. The Federal Highway Administration publishes thresholds for when a lane can come out:
“A great candidate for Road Diets in most instances. Capacity will most likely not be affected.”
“A good candidate for Road Diets in many instances. Agencies should conduct intersection analyses and consider signal retiming in conjunction with implementation.”
“A good candidate for Road Diets in some instances; however, capacity may be affected depending on conditions. Agencies should conduct a corridor analysis.”
“Agencies should complete a feasibility study to determine whether the location is a good candidate. Some agencies have had success with Road Diets at higher traffic volumes.”
FHWA’s 2021 Proven Safety Countermeasures flyer on road diets describes roads with “a current and future average daily traffic of 25,000 or less.” Sources: FHWA, Road Diet FAQ (PDF), FHWA-SA-17-021; FHWA, Proven Safety Countermeasures flyer, Road Diets (FHWA-SA-21-046, 2021).
Dashed lines: under 10,000 vehicles a day, FHWA calls a street “a great candidate for Road Diets in most instances”; from 10,000 to 15,000, “a good candidate for Road Diets in many instances”. Over 20,000 vehicles is where an agency should conduct a feasibility study.
Our counters run continuously on the block. After dark they still count vehicles but can’t sort cars from trucks, so the overnight counts are in the totals but not in the vehicle types. MDOT’s figures are an annual average, built from short counts taken over a few days and adjusted for seasonal and daily variation. Neither count is the “true” number, and neither method has been shown to be more accurate than the other.
Block by block the two differ, from about a third of MDOT’s figure on West Madison Street, where MDOT borrows a station from across I‑83, to nearly double on East Eager Street. On our counts, eight of the ten streets carry fewer than 10,000 vehicles a day; on MDOT’s 2025 estimates, six do.
On either source, every one is under FHWA’s 20,000 screening line. There is no version of this data in which these streets are too busy to change.
fewer crashes after four-lane roads were converted to three lanes, across 45 sites in three states; 29% combined.
fewer collisions, injuries and deaths on Los Angeles road-diet corridors carrying more than 23,000 vehicles a day than on similar untreated corridors, with speeds only about 7 to 8% lower.
Sources: FHWA, Evaluation of Lane Reduction “Road Diet” Measures on Crashes (PDF), FHWA-HRT-10-053 · Venegas, Taylor, Martinez & Hwang, “Take the High (Volume) Road”, Transportation Research Record 2678(6), 2024.
Cities that made these changes measured what happened, and so did Baltimore.
Some merchants along these blocks worry, reasonably, that losing parking or a lane will cost them customers. The curbside parklets that have given Dooby’s and the Helmand room to seat customers on the 800 block of Charles Street since 2020 show how public right-of-way can support a business and the life of the street.
Polk Street in San Francisco is a neighborhood shopping street whose merchants fought a safety redesign on the grounds that their customers drove. The city surveyed 410 people on the sidewalk: 58% had walked, 17% took transit, 5% biked. Only 15% had driven. The people who walked reported spending more money on the street each week than any other group.
Source: SFMTA, Polk Street Intercept Survey Results (PDF), 2013North Charles Street’s bus lane is in effect only 4 to 6 PM and is a parking lane the rest of the day, so it is regularly blocked by parked cars and deliveries. MTA found only 18% of buses used it, and evening bus trips on that stretch got 23.1% slower after it went in.
Hillen Street and Guilford Avenue downtown got an all-day, red-painted bus lane. Evening bus trips there got 31.7% shorter, and morning trips 17.5%. Across the whole downtown bus-lane network, bus-involved crashes fell from 154 to 136, about 12%.
Source: MDOT MTA, Dedicated Bus Lanes: Before and After Study (PDF), 2019inside our study area from 2019 to 2023, per Baltimore City DOT’s crash records. Five people died.
Hoboken, New Jersey has not had a traffic death since January 2017. Among its changes: posts at corners that keep parked cars back from crosswalks, which FHWA’s case study priced at “only $40,” part of a series of measures that cut pedestrian injuries 30% from 2009 to 2011.
Sources: City of Hoboken, March 2026 · FHWA, PEDSAFE case study 74Not one of the ten gives any street space, all day, to a bus or to a protected bike lane. Wouldn’t it be nice if scooters were separated from pedestrians and people walking their dogs?
A traffic lane on Manhattan’s 9th Avenue became a protected bike lane. Retail sales at local businesses on that stretch rose 49% by the third year, against 3% across Manhattan.
Source: NYC DOT, The Economic Benefits of Sustainable Streets (PDF), 2013A classic study of three similar residential streets in San Francisco found that people on the quietest had three times as many local friends and twice as many acquaintances as people on the busiest, a one-way street with synchronized signals. Heavy traffic endangers a neighborhood, and it also wears down the ties that let neighbors watch out for each other. Sources: Appleyard and Lintell, “The Environmental Quality of City Streets,” 1972; Appleyard, Livable Streets, 1981
From the places that have actually done it, on streets busier than any of ours: barely, if at all.
Merrimon Avenue in Asheville, North Carolina carries 13,000 to 22,000 vehicles a day. After its road diet, afternoon trips on the converted section took 47 to 51 seconds longer. In MTA’s Baltimore bus-lane study, drivers’ trips changed by under a minute on average per corridor. On Chicago’s Kinzie Street, car trips took under a minute longer eastbound in the morning and were slightly faster otherwise, while the number of people riding bikes rose 55% after its protected bike lane went in.
Sources: NCDOT, Merrimon Avenue safety and mobility update, August 2026 · MDOT MTA, Dedicated Bus Lanes: Before and After Study (PDF), 2019 · Chicago DOT, Kinzie Street protected bike lane findings (PDF), 2011.
Like other cities nationally, Baltimore’s historic Main Streets are struggling economically, so it’s understandable for people to worry. In reality, merchants tend to overestimate how many of their customers drive, and streets that make room for everyone else have tended to gain business.
61% of people who walked and 58% of people who biked to New York’s East Village visited five or more times a week. In Portland, a study of 89 businesses found that customers arriving by bike, by transit or on foot spent at least as much per month as those who drove, in smaller purchases made more often.
in restaurant sales on Minneapolis’s Central Avenue after bike lanes replaced parking lanes, against 22% on a comparison street.
in the assessed value of property within 500 feet of Indianapolis’s $63 million Cultural Trail, 2008 to 2014. The study notes that part of that rise would likely have happened anyway.
Sources: Transportation Alternatives, The East Village Shoppers Study (PDF), 2012 · Clifton et al., Examining Consumer Behavior and Travel Choices (PDF), OTREC-RR-12-15 · Transportation Research and Education Center, Minneapolis street improvements study (PDF), 2020 · Indiana University Public Policy Institute, Indianapolis Cultural Trail study (PDF), 2015.
Five changes, in order of priority. Most can start with paint, signs and signal timing.
Five of our ten counted streets are posted 30 mph: North Calvert, East Preston, Saint Paul, East Franklin and North Charles. At 30 mph, 47% of people hit are killed or severely injured; at 25, 30%. Baltimore’s Complete Streets Manual sets a target speed of 20 to 25 mph for streets like ours.
A sign alone isn’t enough: East Madison is already posted 25, and one car in three there goes faster. The signals should be timed to match. The Manual says signal progression “should be set based on the target speed. For the majority of urban roadways, this should be 20 mph.”
Stops on North Charles and Saint Paul Streets see 1,195 bus boardings every weekday, and the buses sit in ordinary traffic. The peak-hour lane on North Charles was used by 18% of buses, and evening trips there got 23.1% slower. Guilford Avenue’s all-day, red-painted lane cut evening bus travel time 31.7%. Our streets need lanes like that one: all day, painted red, and kept clear.
The southbound I‑83 exit ramp at Mount Royal Avenue carries about 7,735 vehicles a day. About 5,552 of them take the leg that feeds straight onto Saint Paul Street, up to 74% of the traffic on our Saint Paul block. Closing the ramp would keep downtown commuters on the highway instead of using our neighborhood as a shortcut.
Half of our counted streets are on the city’s draft High-Injury Network. Inside our study area, North Calvert Street had the most crashes that killed or seriously injured someone of any corridor: 8 from 2019 to 2023.
Quick builds can test road diets with paint and posts, add curb extensions that shorten crossings, keep parked cars back from crosswalks, and give people walking a head start at the light. The long-term goal is permanent design: two-way street conversions, concrete curb extensions, protected bike lanes, and wider sidewalks that make the changes permanent.
Our East Madison counter sees about 300 trucks a day on a block that isn’t a truck route. The city’s through-truck routes near us are MLK Boulevard, Howard Street, North Avenue and I‑83.
City law caps the truck height-monitoring cameras that enforce these routes at 16 operating at once. None of the city’s 19 current camera locations is in Mount Vernon; the majority are in East and Southeast Baltimore due to port traffic. Getting a camera to Mount Vernon may mean revisiting that cap.
Sign up for MVBA Safe Streets updates and follow Bikemore to hear about ways to get involved and demand change.
Decisions about these streets get made in rooms, on specific dates, and they turn on how many neighbors are in the room. We will tell you when those moments are coming, and what to say.
Bikemore advocates citywide for streets that work for everyone, and does the technical work behind reports like this one. Following along is how you find out which fights are live.
Membership is open to residents, businesses and institutions inside the MVBA boundaries, and it is what funds work like this. Members get the monthly newsletter and a vote on what the association pushes for.
General meetings are open to the public, on the third Tuesday of January, March, May, July, September and November, starting at 7 PM, at First and Franklin Presbyterian Church, Park Avenue Chapel, 210 West Madison Street (Park Avenue entrance).
The Mount Vernon-Belvedere Association has represented this neighborhood since 1938. By its own account, it has stopped a proposed state prison from going into a residential block, built the Mount Vernon Children’s Park by raising $350,000 in a single year, planted 50 to 100 trees annually, and sent the largest delegation in Maryland to Annapolis to advocate for historic tax credits.
Safer streets are the same work. A neighborhood where most of the drivers on a block can be breaking the speed limit at once is not one where growth and quality of life are secure.
What our counters are: ten Telraam S2 sensors, each a small camera in a volunteer’s window. They do not capture or store images, video, faces or license plates, only anonymous counts of road users by type and speed. Nine have been counting since April or May 2025. West Mulberry Street’s counter has usable data from February 16, 2026; its earlier readings were near zero, and Telraam’s public record for that block starts on that date.
Period: figures cover September 1, 2025 through August 31, 2026, in Baltimore local time (daylight saving time handled), except West Mulberry Street (February 16 through August 31, 2026). East Preston Street’s counter was down for several stretches, including August 8 to 31, 2026.
Posted limits: from OpenStreetMap for the six blocks where it agrees with the city’s street centerline data. For North Charles, West Mulberry, North Calvert and East Franklin, where public datasets disagree, Bikemore checked the posted signs in Google Street View imagery.
Speed: Telraam measures the speed of cars only, in 5 km/h bands, in daylight. Where a threshold falls inside a band, we assume speeds are spread evenly across it. We count an hour only if at least 100 cars were measured and the counter was working for at least 80% of it. Telraam puts speed accuracy at about ±10%, which is why we also report the share of cars at 35 mph or more. “Worst daylight hour” is the hour with the highest share over 25 mph among hours when the sun was up for the whole hour.
Safe speed limit: for the streets posted 30 mph, the speeding table measures every figure against 25 mph, the top of the Complete Streets Manual’s target range, rather than the posted limit. The North Calvert Street example gives both.
Large vehicles: Telraam’s “heavy” class is everything bigger than a car: buses, vans, trucks, trailers and tractors. Shares are of the vehicles classified in daylight. After dark the counters count crossings without classifying them.
Daily traffic: we average each of the 168 hours of the week over every hour the counter was working at least 80% of the time, then add them up. Overnight crossings are included; Telraam says night counts “are an aggregation of motorised vehicles.” We do not fill missing hours or scale up partial ones.
People walking and biking: these are trips past a counter in daylight, not people: one person can pass several counters, and a counter sees only part of the sidewalk. “Biking” includes motorcycles.
State counts: MDOT SHA’s 2025 Annual Average Daily Traffic for the nearest station on each street, most of them estimates from short counts. Some stations are on the same or the next block; others are farther away or across a ramp or major junction.
Crashes: Baltimore City DOT crash records, 2019 to 2023, inside our study area: Mount Vernon and Mid-Town Belvedere as the Department of Planning draws them, plus MVBA’s own boundary south to Saratoga Street, which takes in the Franklin and Mulberry blocks we counted. People are counted once each: the city’s High-Injury Network and crash-summary layers count rows that pair every passenger with every driver, which overstates people in multi-vehicle crashes. The High-Injury Network is the city’s draft, and its source has no 2019 walking or biking crashes; we added them from the city’s own pedestrian and bicycle layers.
Buses: Maryland Open Data, MTA Bus Stops, summer 2024 average weekday boardings at stops on North Charles and Saint Paul between Saratoga Street and I‑83, the newest stop-level data published. Routes from MTA’s August 2026 schedule data.
Pedestrian survival figures: these are impact speeds from Tefft (2011), not travel speeds, and explain why speed matters; they do not predict any measured hour.